Spring/Java Application Monitoring Basics - Part 2
Let's set up Prometheus and Grafana in dev environment.
Prometheus
Prometheus is one of the leading open-source monitoring tools and it is cloud-native. It has simple and powerful data model with richly featured query language PromQL. It collects measurements via multiple exporters and the service it easily pluggable to visualisation tools like Grafana.
Dev environment set-up
Having the separate visualisation tool is preferred to view the multiple metrics as graphs. Hence, we set-up Prometheus and Grafana together in this docker-compose.
docker-compose.yaml
version: '3.7'

volumes:
  prometheus_data: {}
  grafana_data: {}

networks:
  front-tier:
  back-tier:

services:
  prometheus:
    image: prom/prometheus:v2.45.3
    container_name: prometheus
    volumes:
      - '$PWD/prometheus.yml:/etc/prometheus/prometheus.yml'
      - prometheus_data:/prometheus
    ports:
      - 9090:9090
    networks:
      - back-tier
    restart: always

  grafana:
    image: grafana/grafana-enterprise:7.4.5
    container_name: grafana
    depends_on:
      - prometheus
    ports:
      - 3000:3000
    volumes:
      - grafana_data:/var/lib/grafana
    networks:
      - back-tier
      - front-tier
    restart: unless-stopped
If you gone through the above yaml, we configured the following things.
Volumes for Prometheus and Grafana.
Network bridge for services.
Prometheus service with 9090 enabled and registered it as back-tier
- Setting
prometheus.yamlas external file to manage configurations easily.
- Setting
Grafana service with 3000 enabled and registered it as both front-tier and back-tier for bridging the network between services.
prometheus.yaml
# my global config
global:
  scrape_interval: 15s # Set the scrape interval to every 15 seconds. Default is every 1 minute.
  evaluation_interval: 15s # Evaluate rules every 15 seconds. The default is every 1 minute.
  # scrape_timeout is set to the global default (10s).

# Alertmanager configuration
alerting:
  alertmanagers:
    - static_configs:
        - targets:
          # - alertmanager:9093

# Load rules once and periodically evaluate them according to the global 'evaluation_interval'.
rule_files:
  # - "first_rules.yml"
  # - "second_rules.yml"

# A scrape configuration containing exactly one endpoint to scrape:
# Here it's Prometheus itself.
scrape_configs:
  # The job name is added as a label `job=<job_name>` to any timeseries scraped from this config.
  - job_name: "prometheus"

    # metrics_path defaults to '/metrics'
    # scheme defaults to 'http'.
    static_configs:
      - targets: ["localhost:9090"]
In the above prometheus.yaml, we configured the below things.
Global
scrape intervalandevaluation intervalOnly one prometheus scrape job named
prometheusto collect its own metrics.
Bring up the services
As you know already, docker-compose in your system is the prerequisites.
Have the above files
docker-compose.yamlandprometheus.yamlin the separate folder.Execute the command
docker-compose upto bring up the services or the following command to bring up in detach mode.
docker-compose up -d
- Goto
localhost:9090is in your browser and executeprometheus_readyto make sure the prometheus up and running.

- Goto
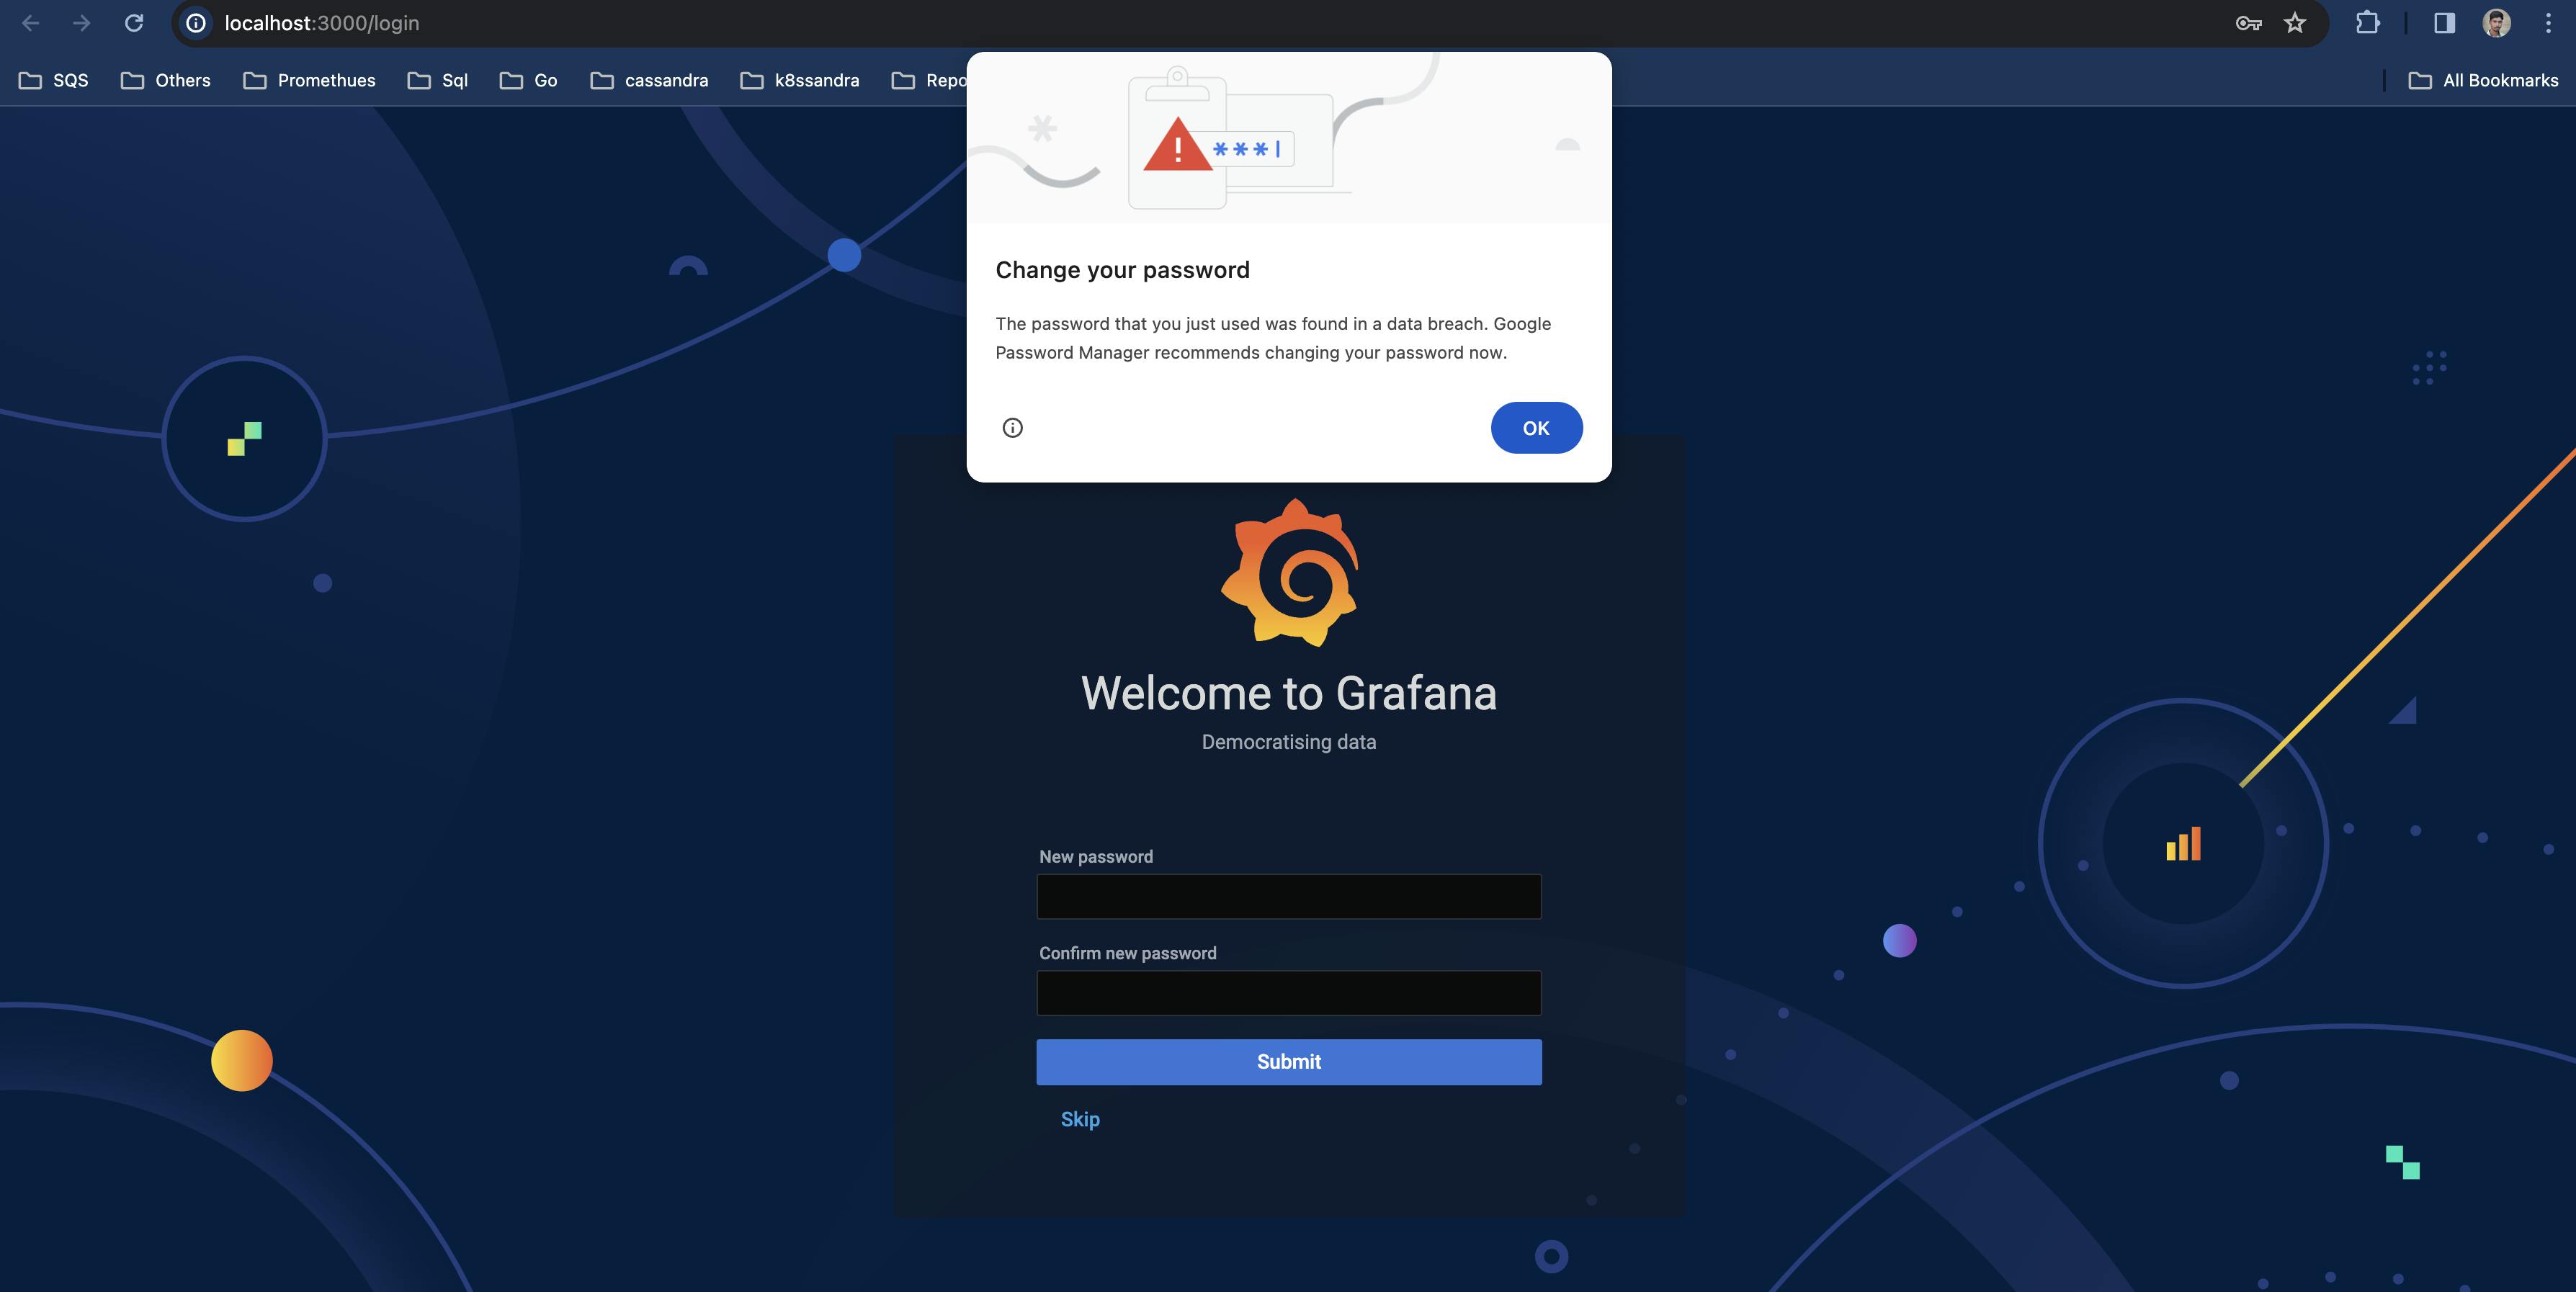
localhost:3000in your browser to configure the Grafana. Default username and password isadmin.

After changing your password, please configure the prometheus datasource in Grafana services using below steps.
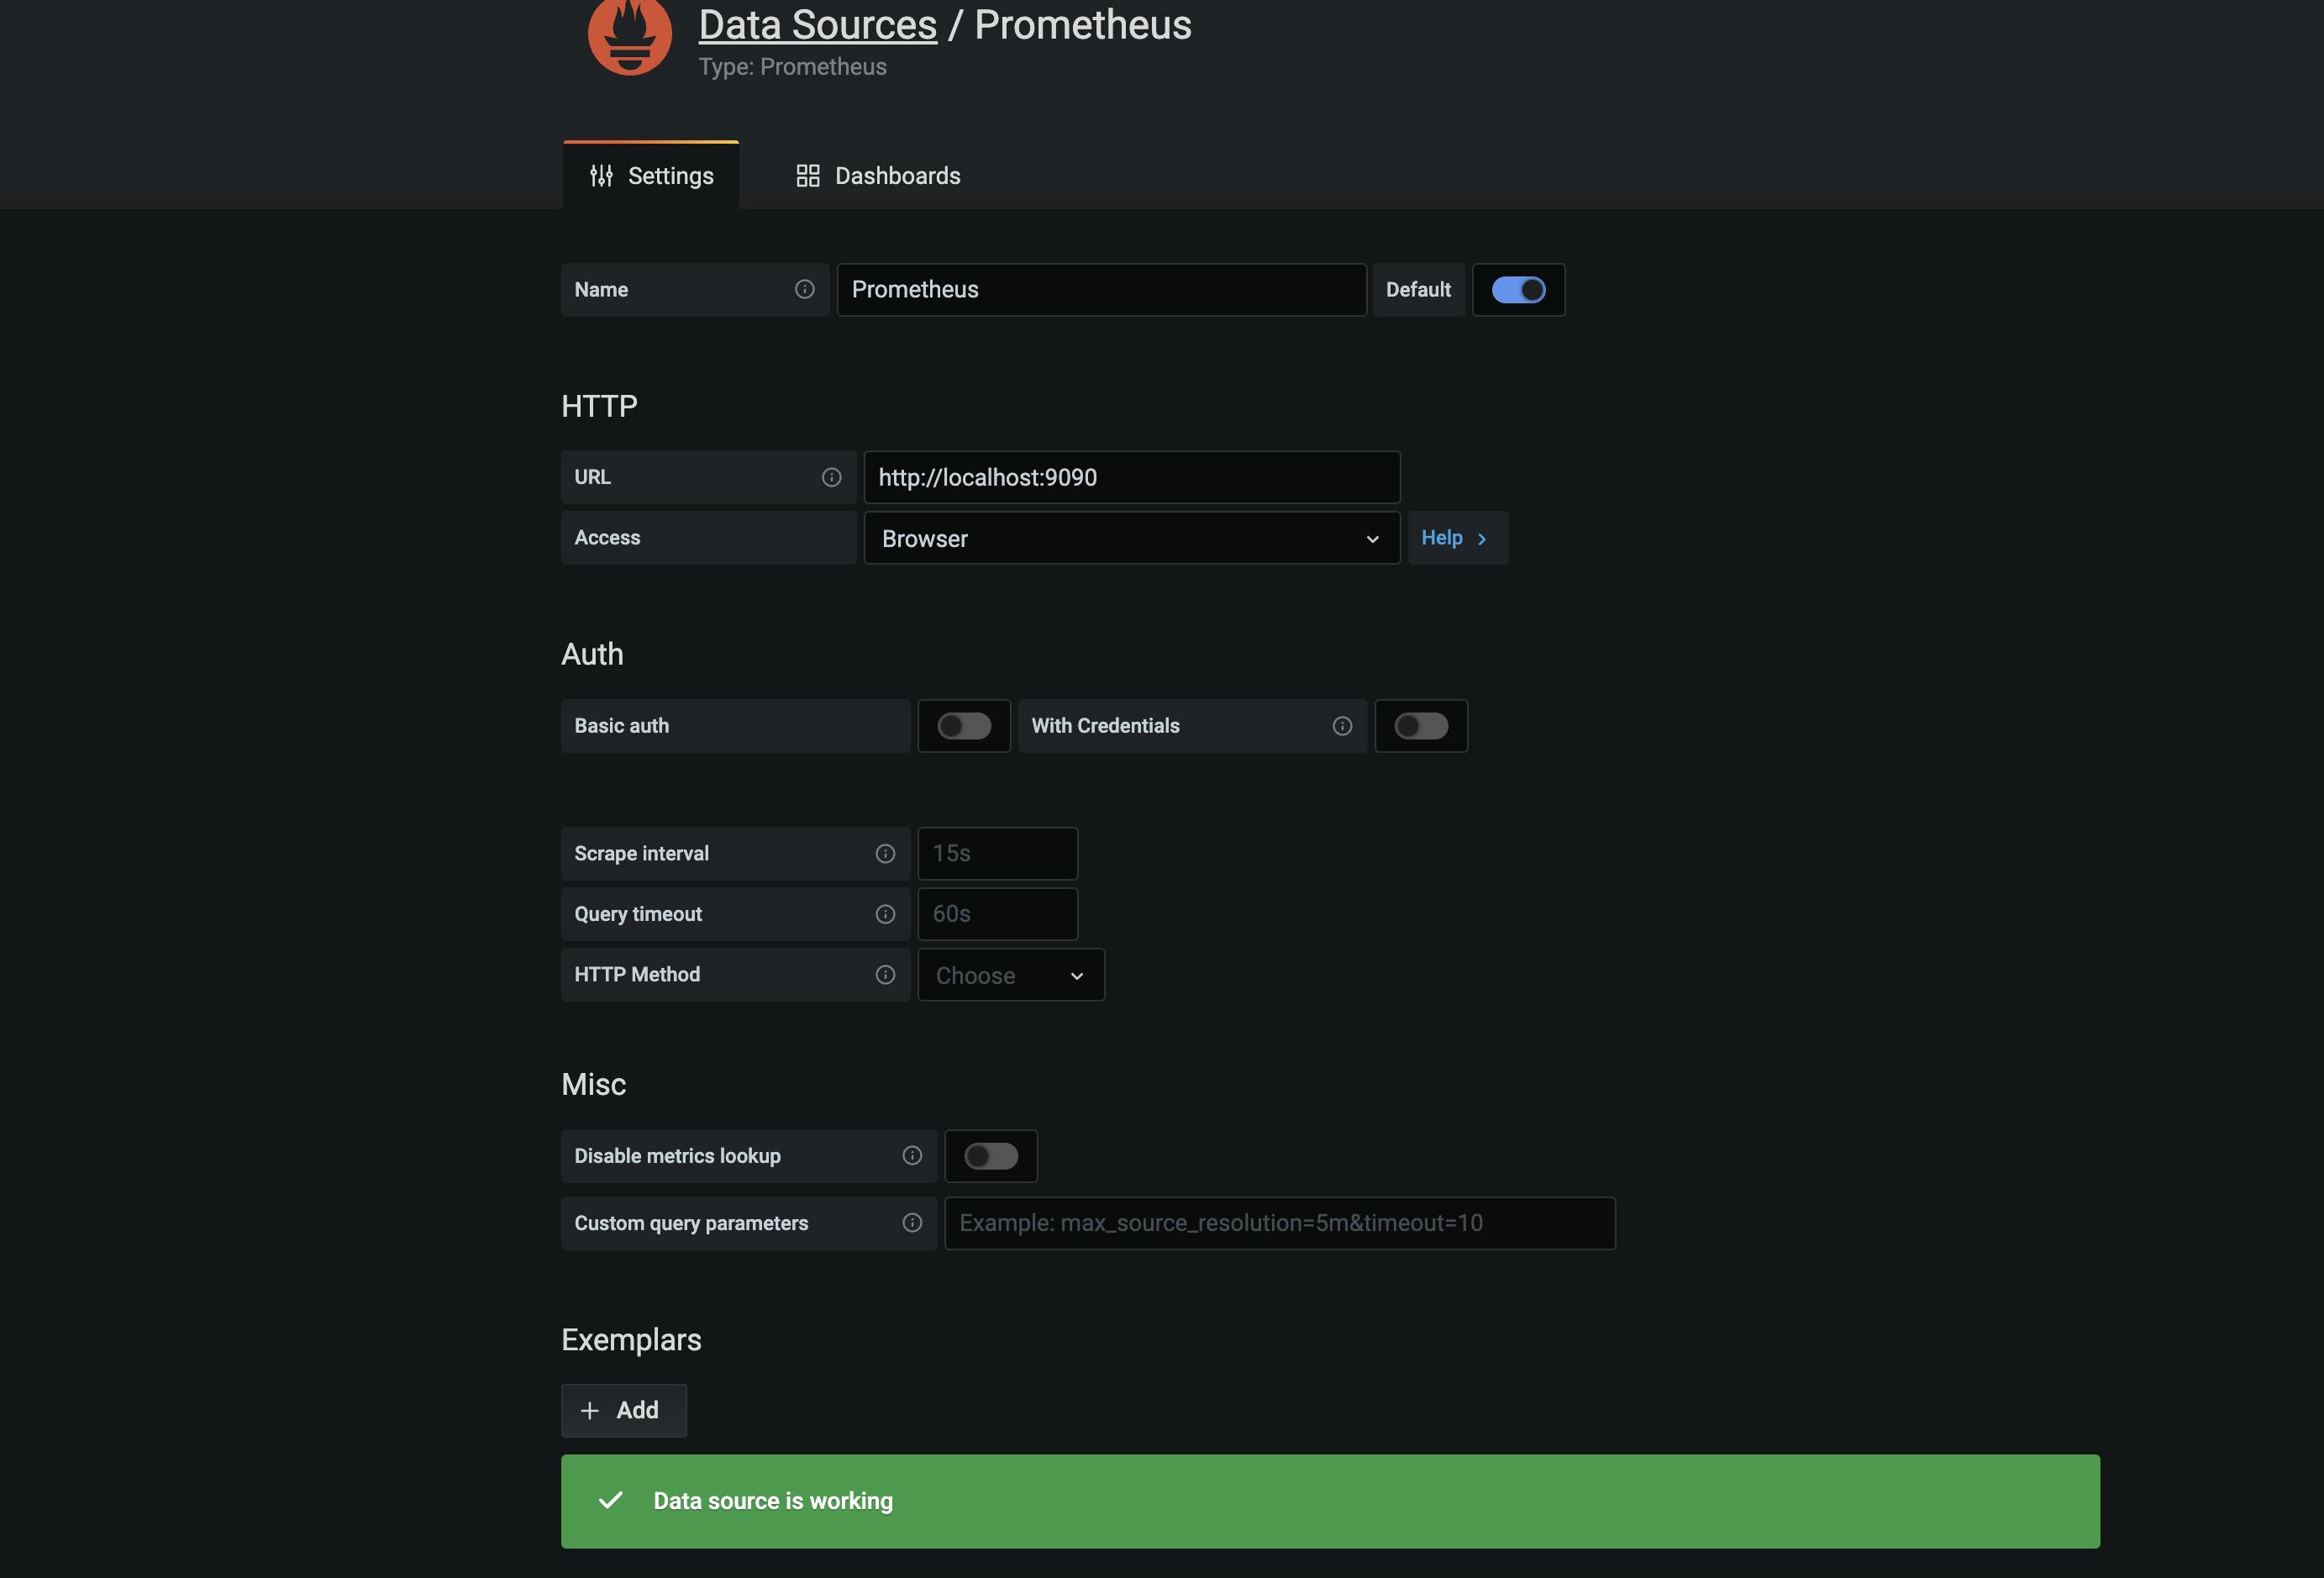
Configuration --> Data Sources --> Add data source --> Select Prometheus
Provide
http://localhost:9090in URLChoose
BrowserasAccessClick
Save & Testbutton

- Move to
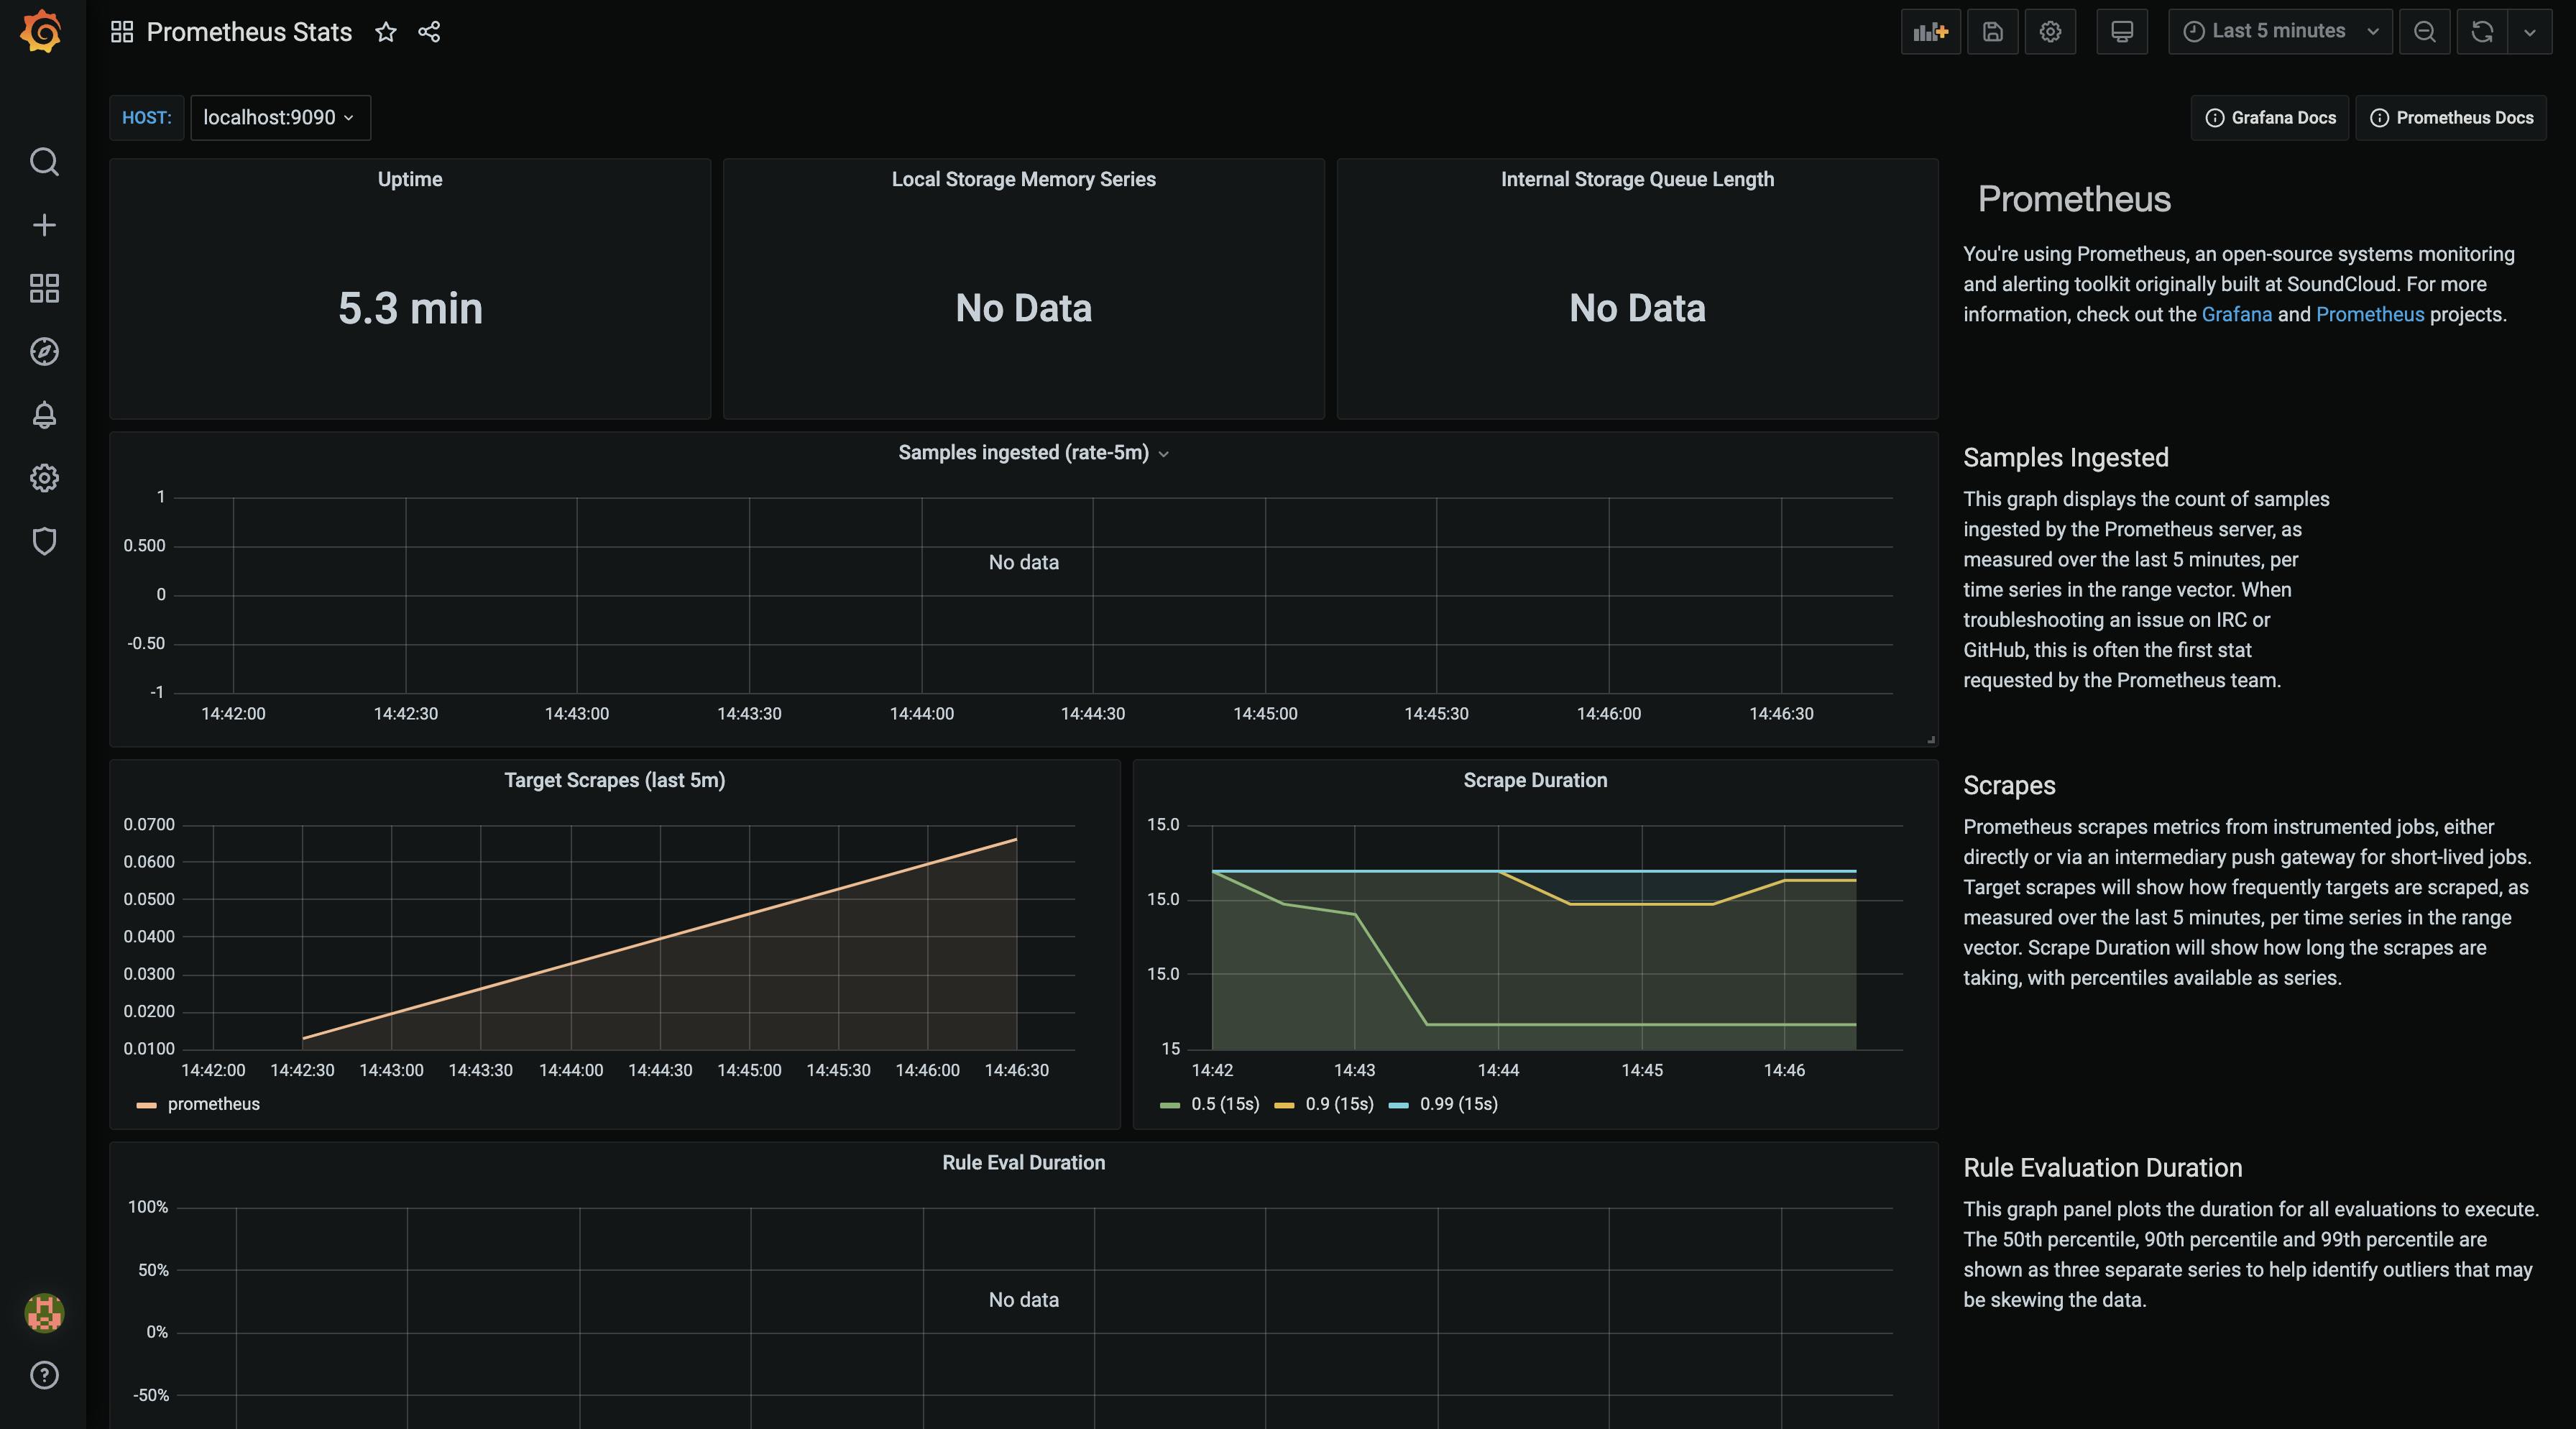
Dashboardssection and importPrometheus StatsandPrometheus 2.0 Statsdashboards.

Open the dashboard
Prometheus StatsIt shows the uptime.

There you go. Your local set-up is ready to serve all your needs.