Spring/Java Application Monitoring Basics - Part 3
Enable Prometheus monitoring for Spring Boot Application and visualise it
Enable Prometheus Metrics in spring App
I assume you have Spring boot web application ready to use for this project. If not, please get started with spring boot project.
Spring actuator provides out of the box monitoring features for spring boot apps. Micrometer APIs are there in actuator bundle which supports multiple metrics systems. Curious to know why spring use micrometer APIs, please checkout this.
implementation 'org.springframework.boot:spring-boot-starter-actuator'
Spring actuator auto-configure package enables some built-in endpoints like actuator/health and actuator/info

To enable prometheus as actuator endpoint,
- Add implement prometheus dependency. Thus, two dependencies are added.
implementation 'org.springframework.boot:spring-boot-starter-actuator'
implementation 'io.micrometer:micrometer-registry-prometheus:1.10.6'
- Add the below config in
application.properties.
management.endpoints.web.exposure.include=health,info,prometheus

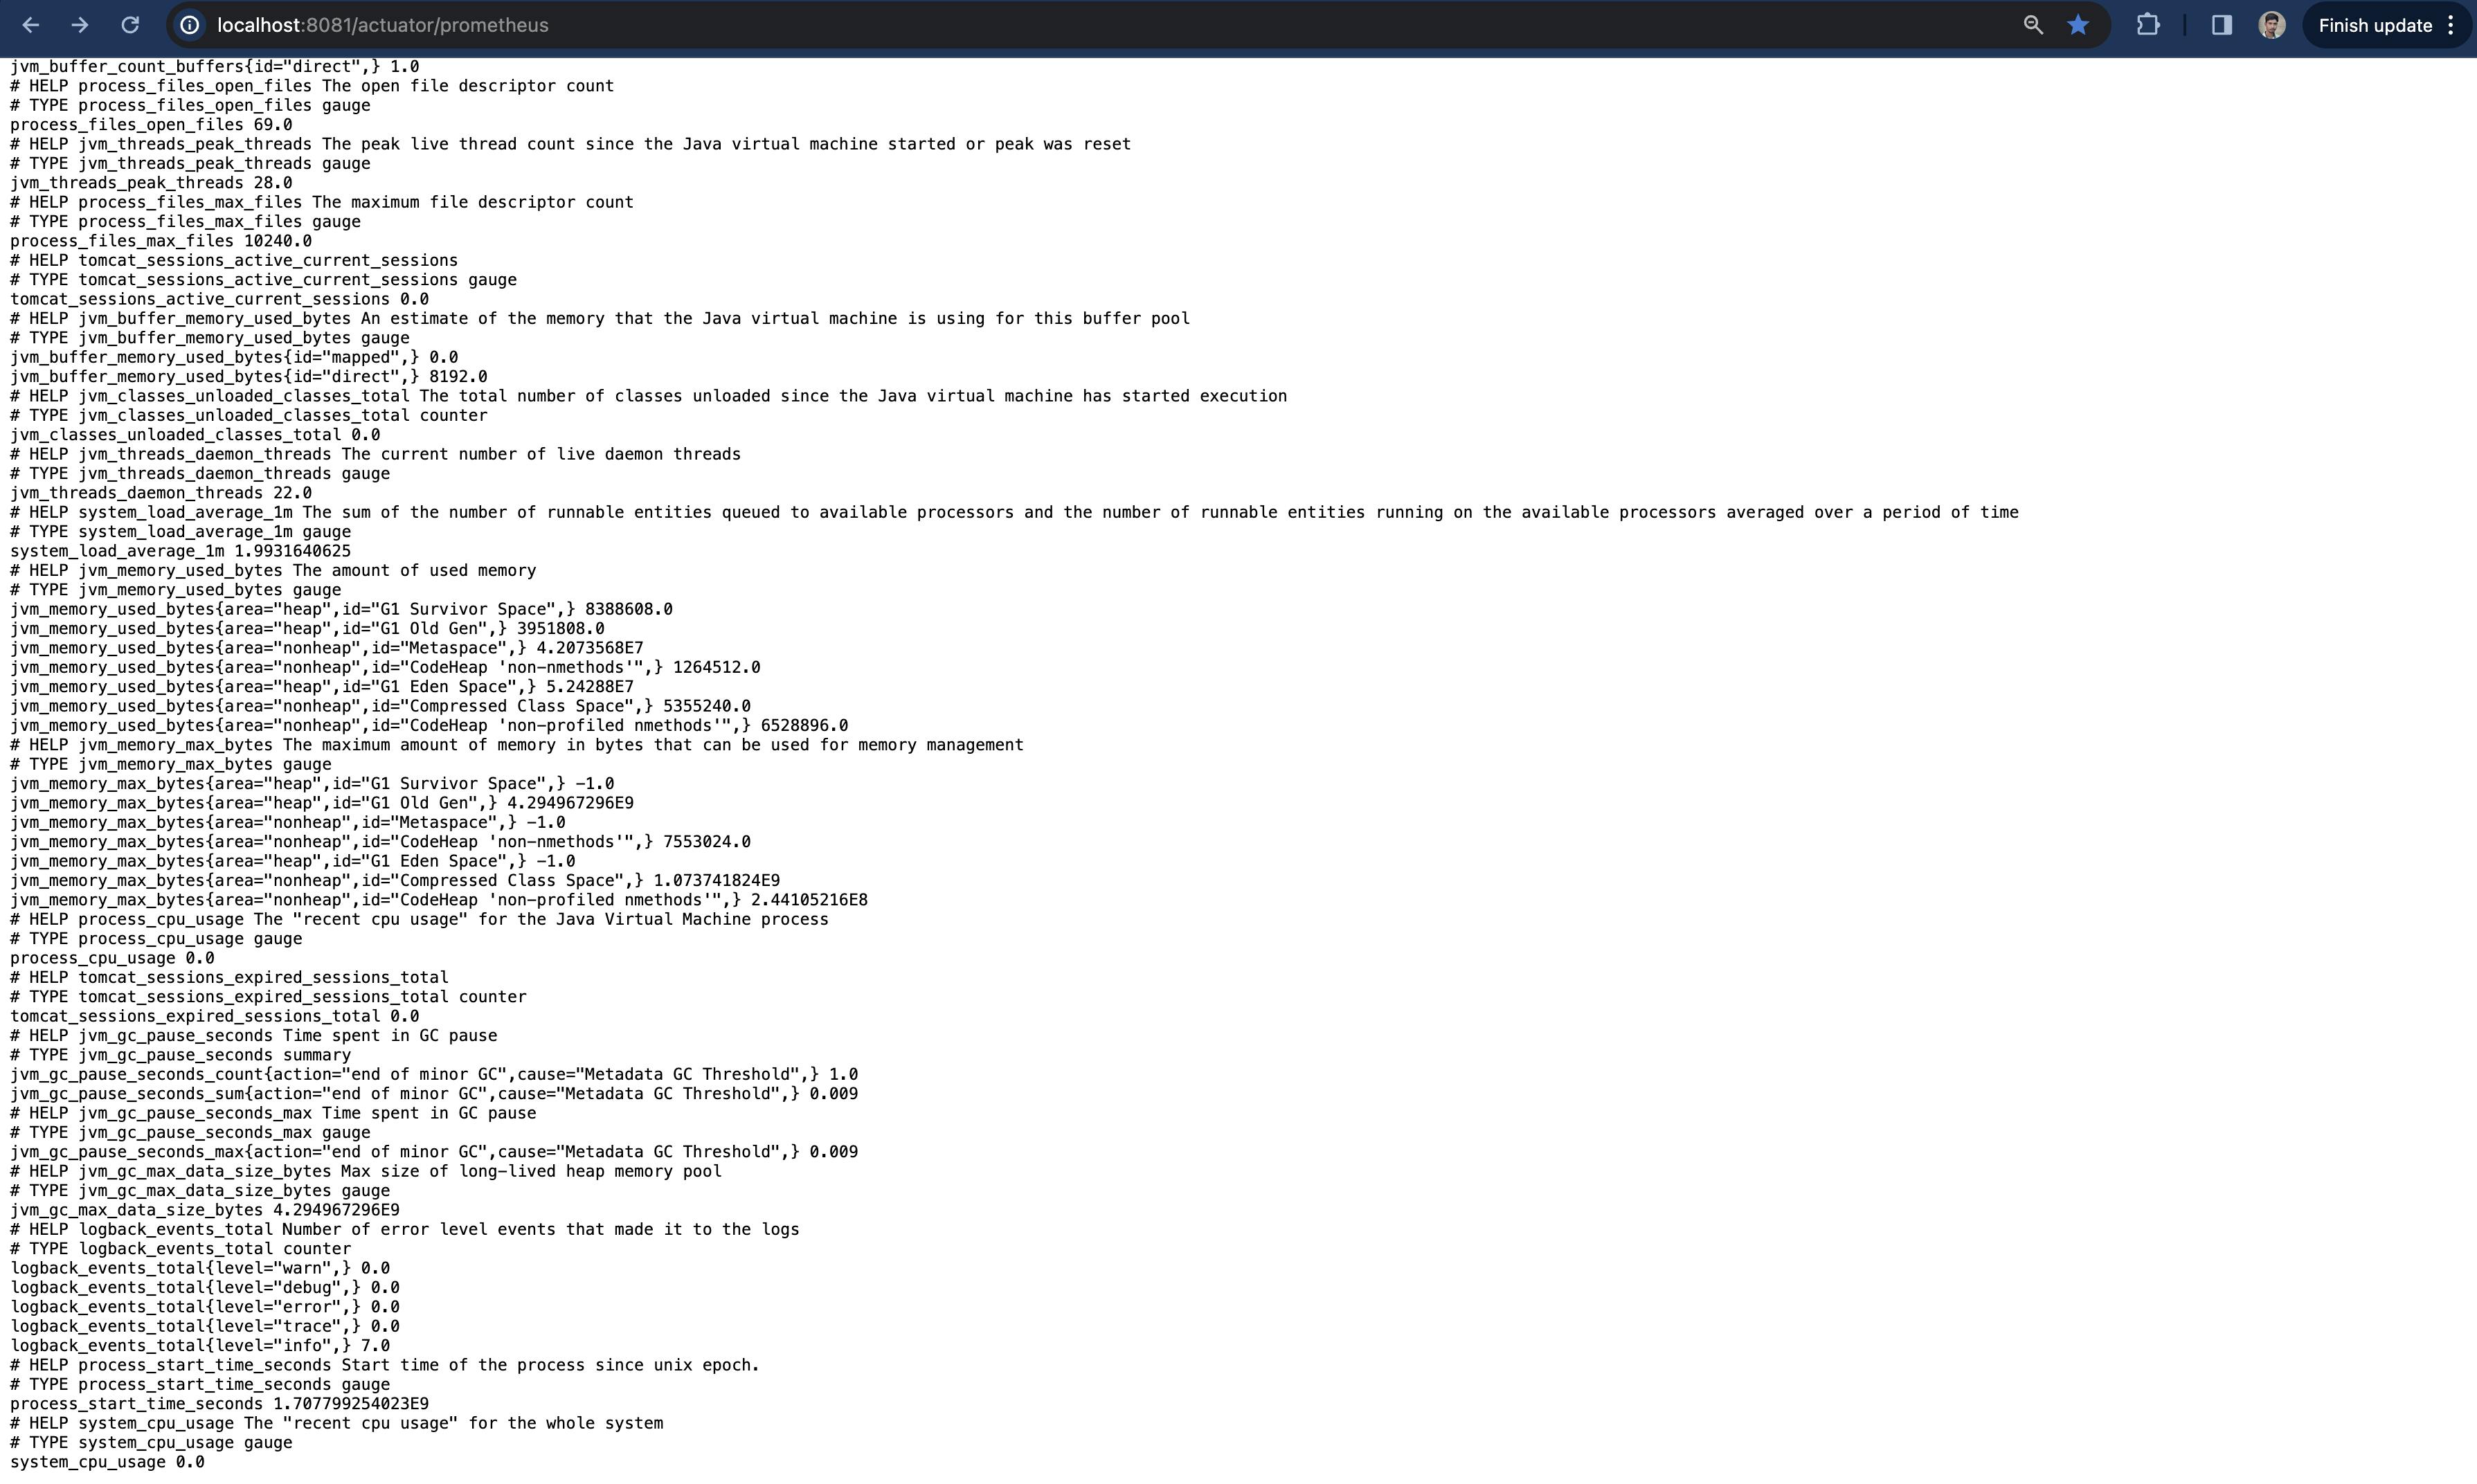
On curling /actuator/prometheus, you can see the different set of metrics like CPU metrics, Uptime metrics, JVM metrics, Tomcat metrics, Logback metrics which are auto-configured in actuator project. Lets scrape and visualise them in next sections.
Scrape Spring Boot Metrics from Prometheus Server
To setup the Prometheus and Grafana in local, please refer Spring/Java Application Monitoring Basics - Part 2
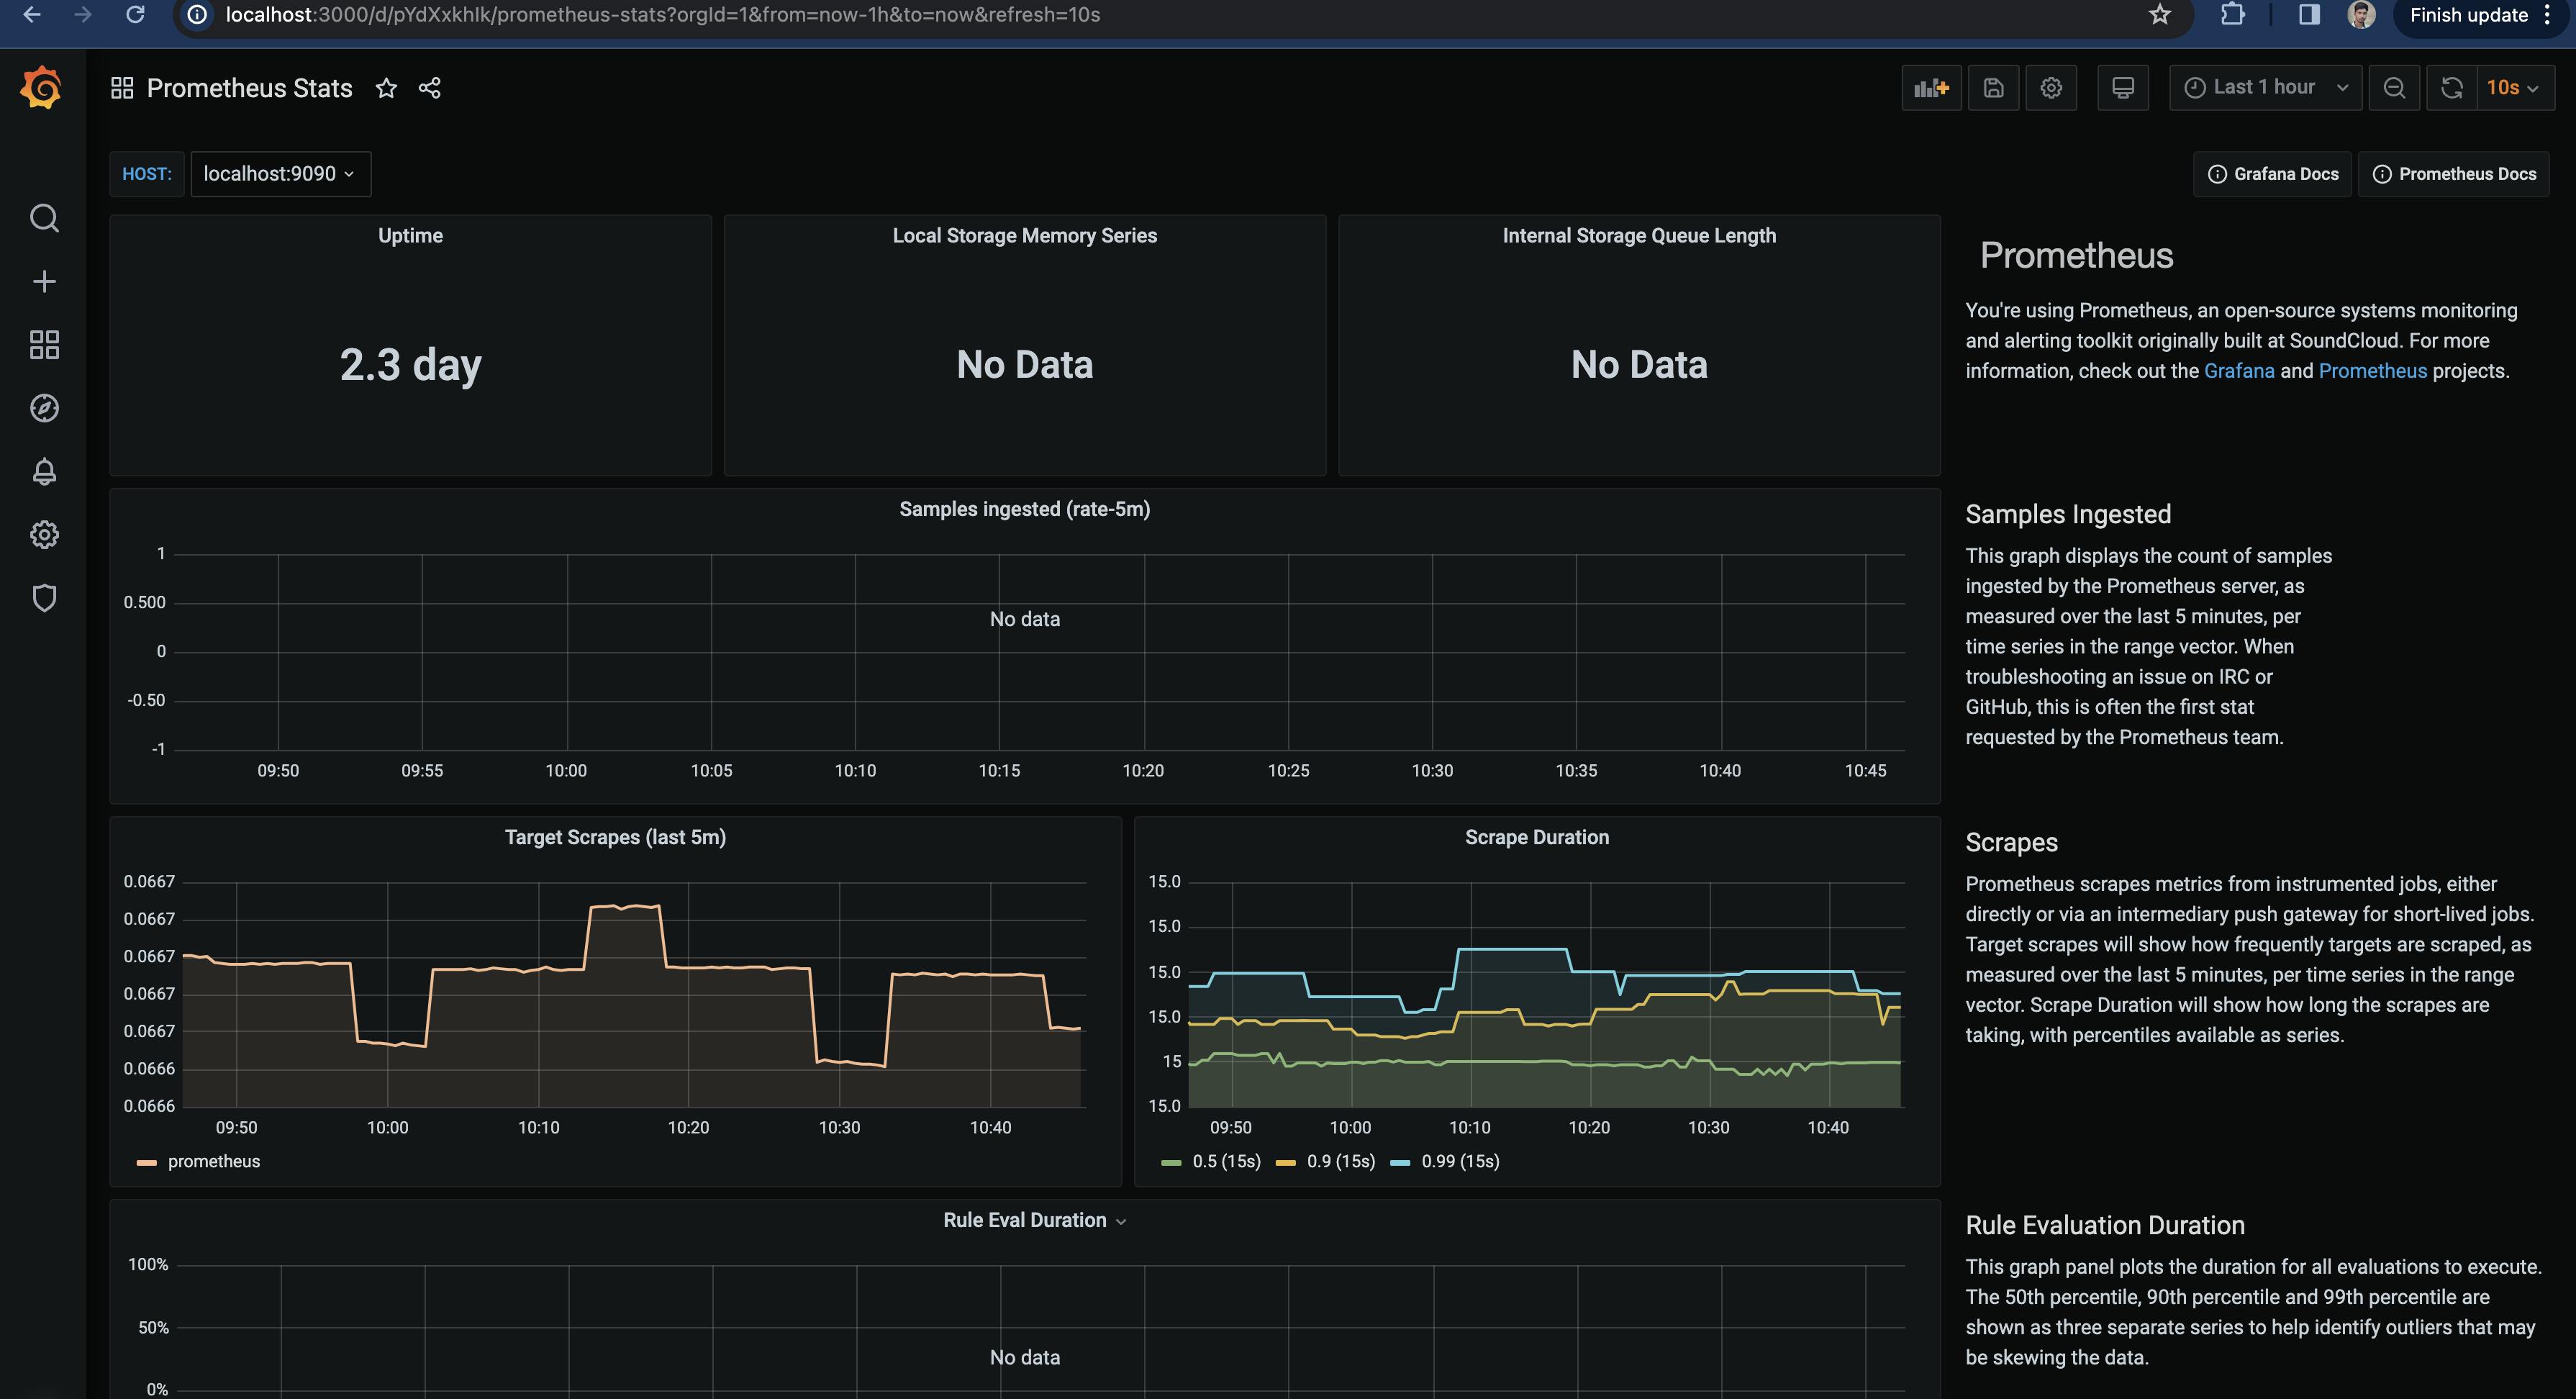
Once the above set-up is done, below dashboard is available in Grafana localhost:3000 with prometheus server metrics.
In prometheus server, we have to set up the job to scrape the spring metrics available at /actuator/prometheus. To do so,
- Set up the below job in
prometheus.yaml.
  - job_name: "spring-app"
    metrics_path: '/actuator/prometheus'
    scheme: 'http'
    static_configs:
      - targets: [ "[YOUR_SYSTEM_IP_ADDRESS]:8080" ]
- Re-start the docker using
docker-compose up -d
Check your prometheus localhost:9090 with process_uptime_seconds. You can see the metric with job named spring-app has a positive value.

Note: Try with host.docker.internal in place of [YOUR_SYSTEM_IP_ADDRESS] . If it doesn't work, please use you system ip-address
Configure Grafana Dashboard for SpringBoot Web Application
Grafana labs provides multiple pre-built dashboards for Micrometer metrics.
JVM (Micrometer) is the good candidate to start with. It uses tag called
applicationto distinguish multiple applications in each query.Thus, Add the below config in
application.propertiesand restart your spring application.
management.metrics.tags.application=${spring.application.name}
- Now you can see
process_uptime_secondsquery in prometheus have new label calledapplication.

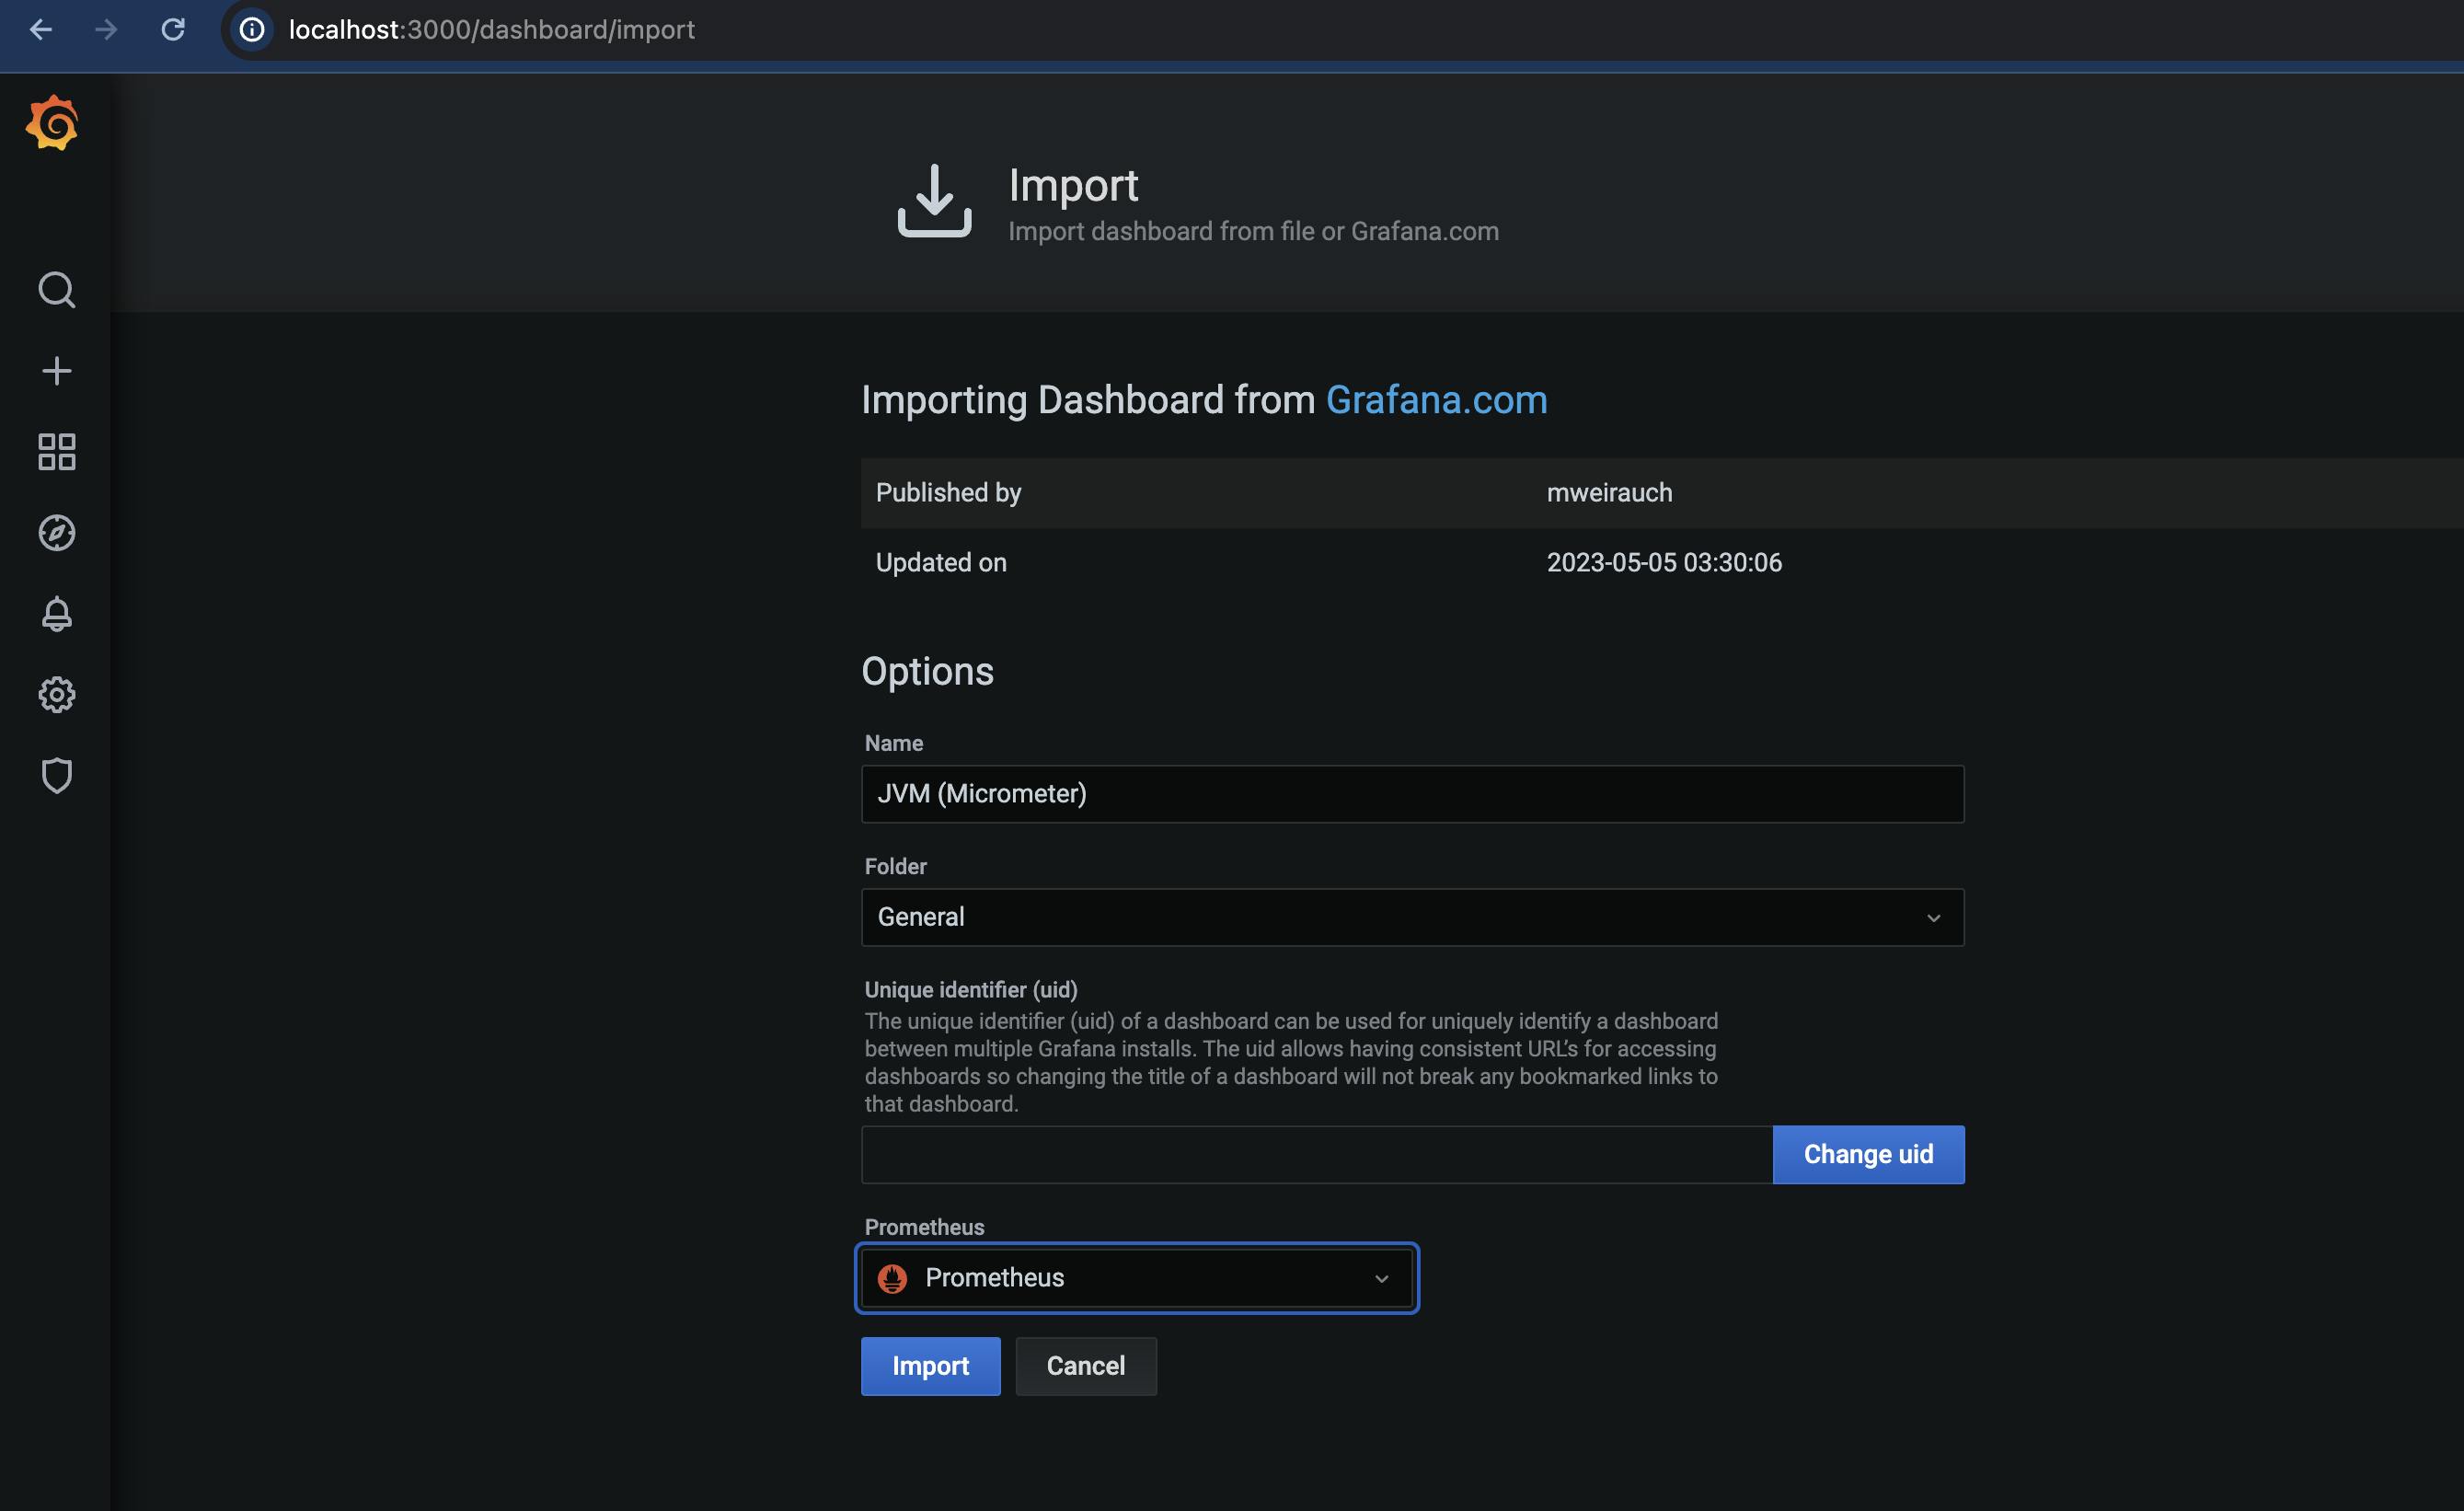
Import the mentioned JVM (Micrometer) dashboard.
Choose
+->Import->4701in Import via Grafana.com ->Load
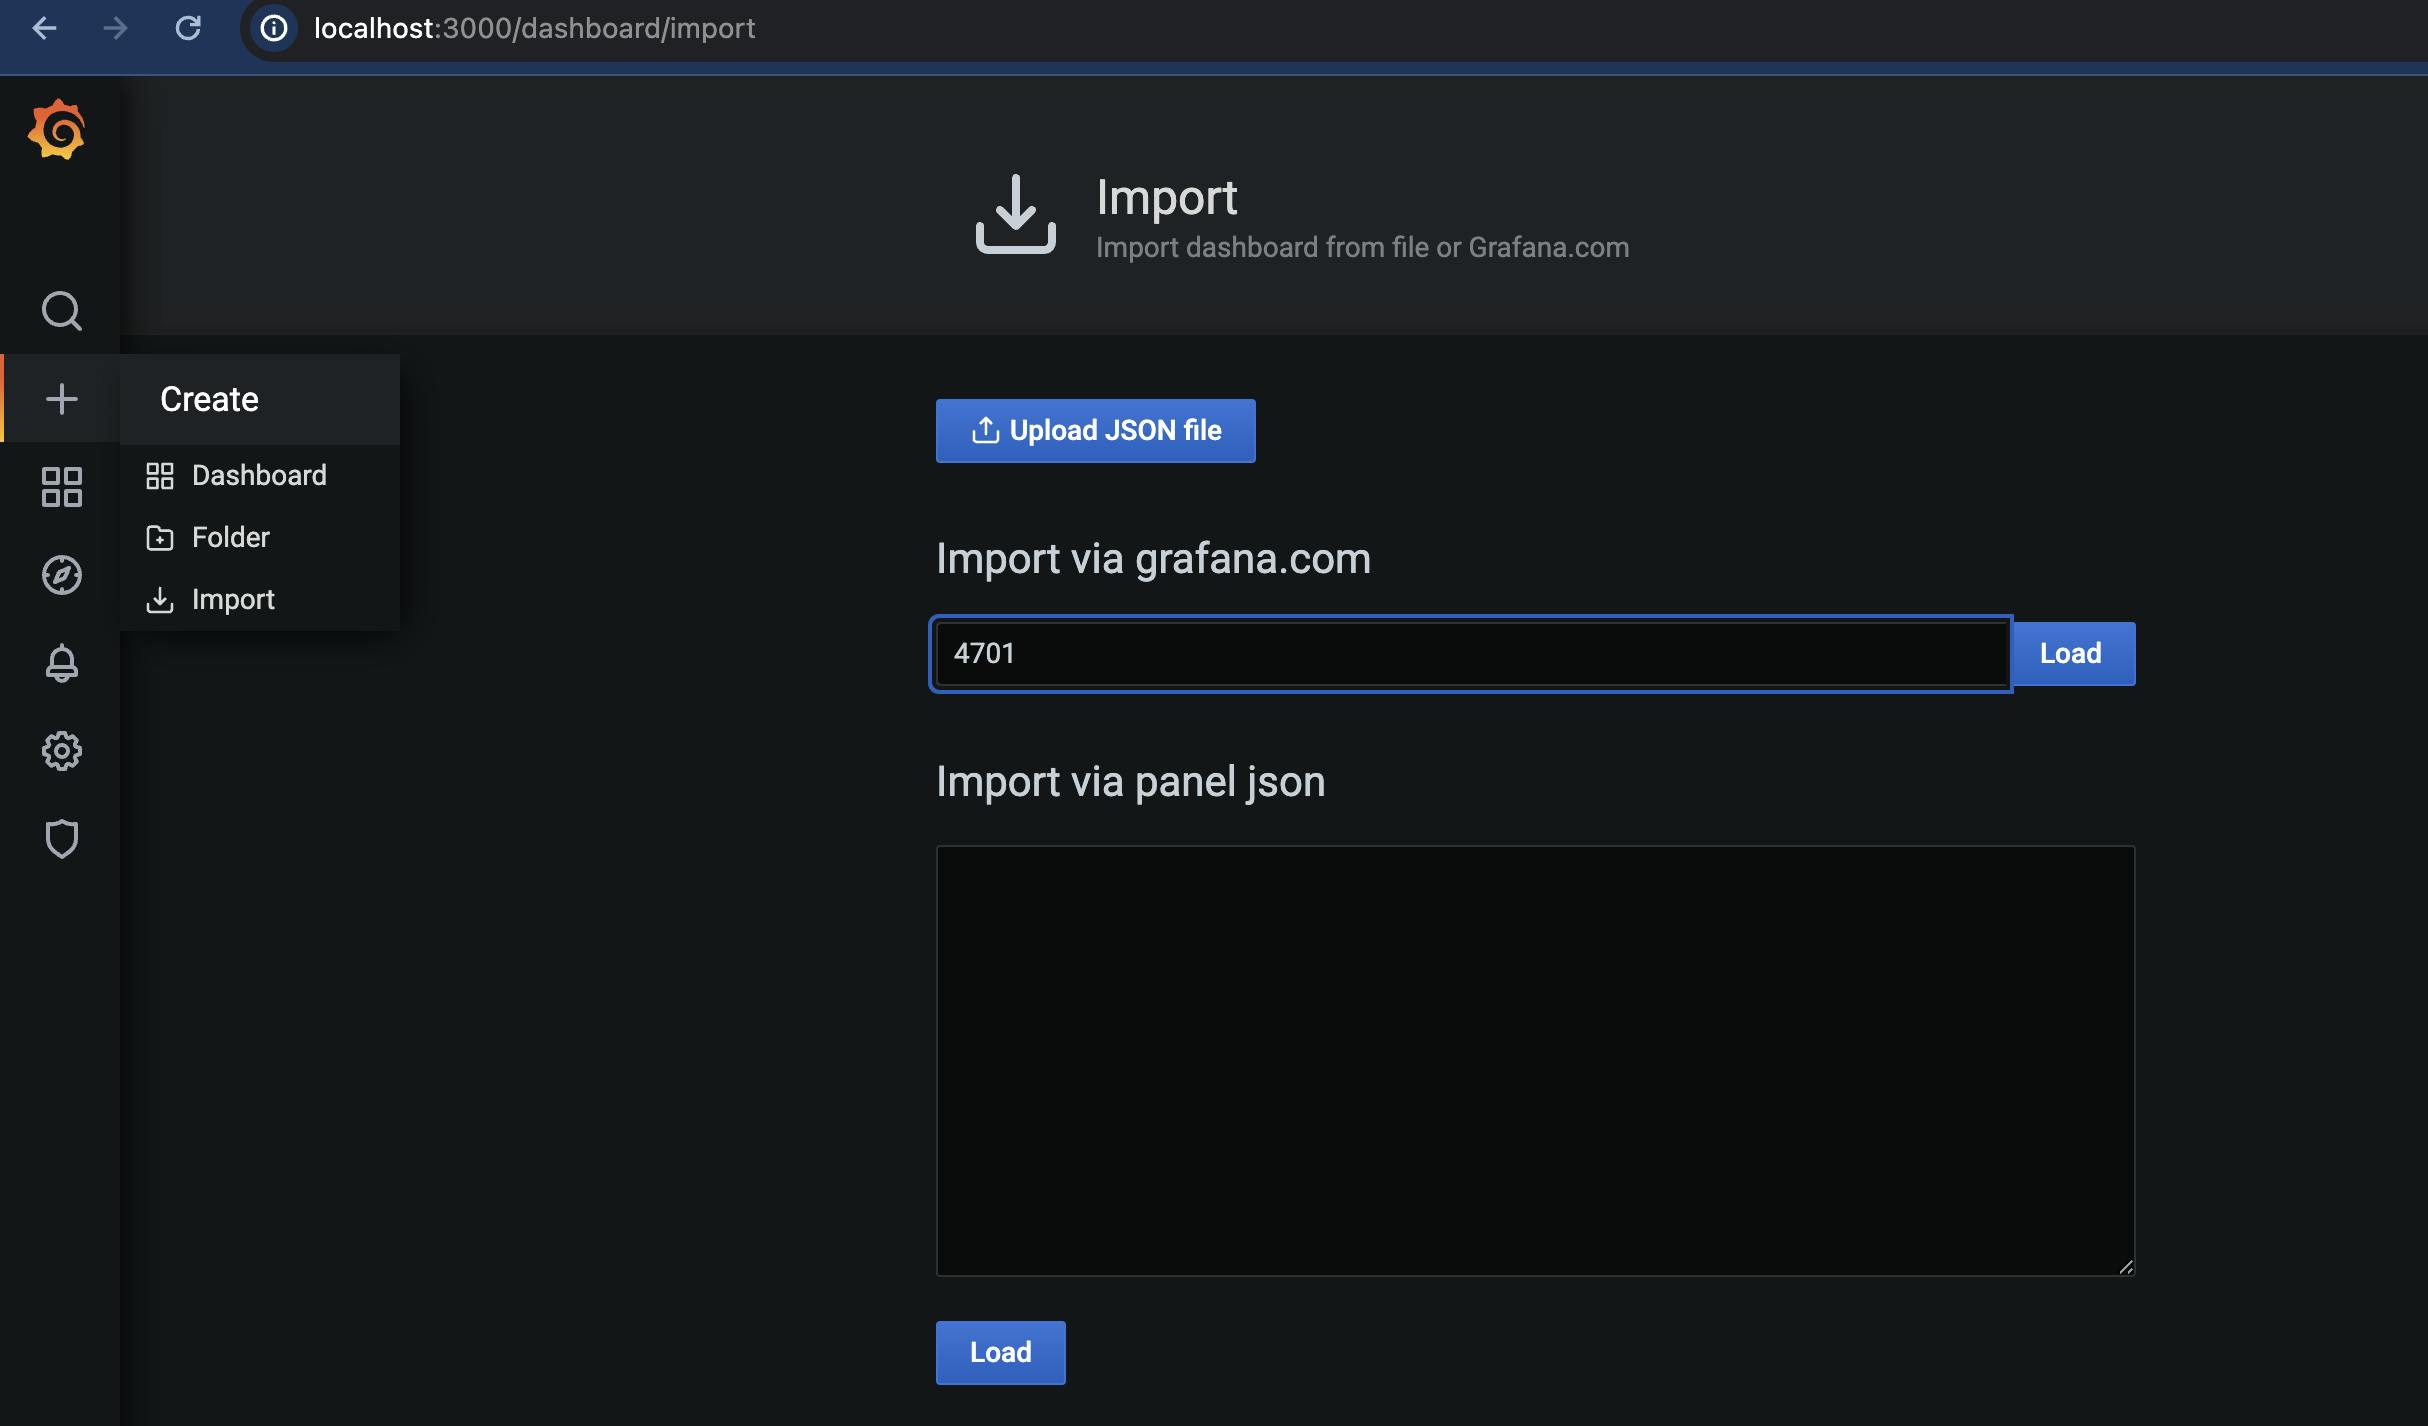
- Choose
Prometheusas Prometheus datasource and clickImport.
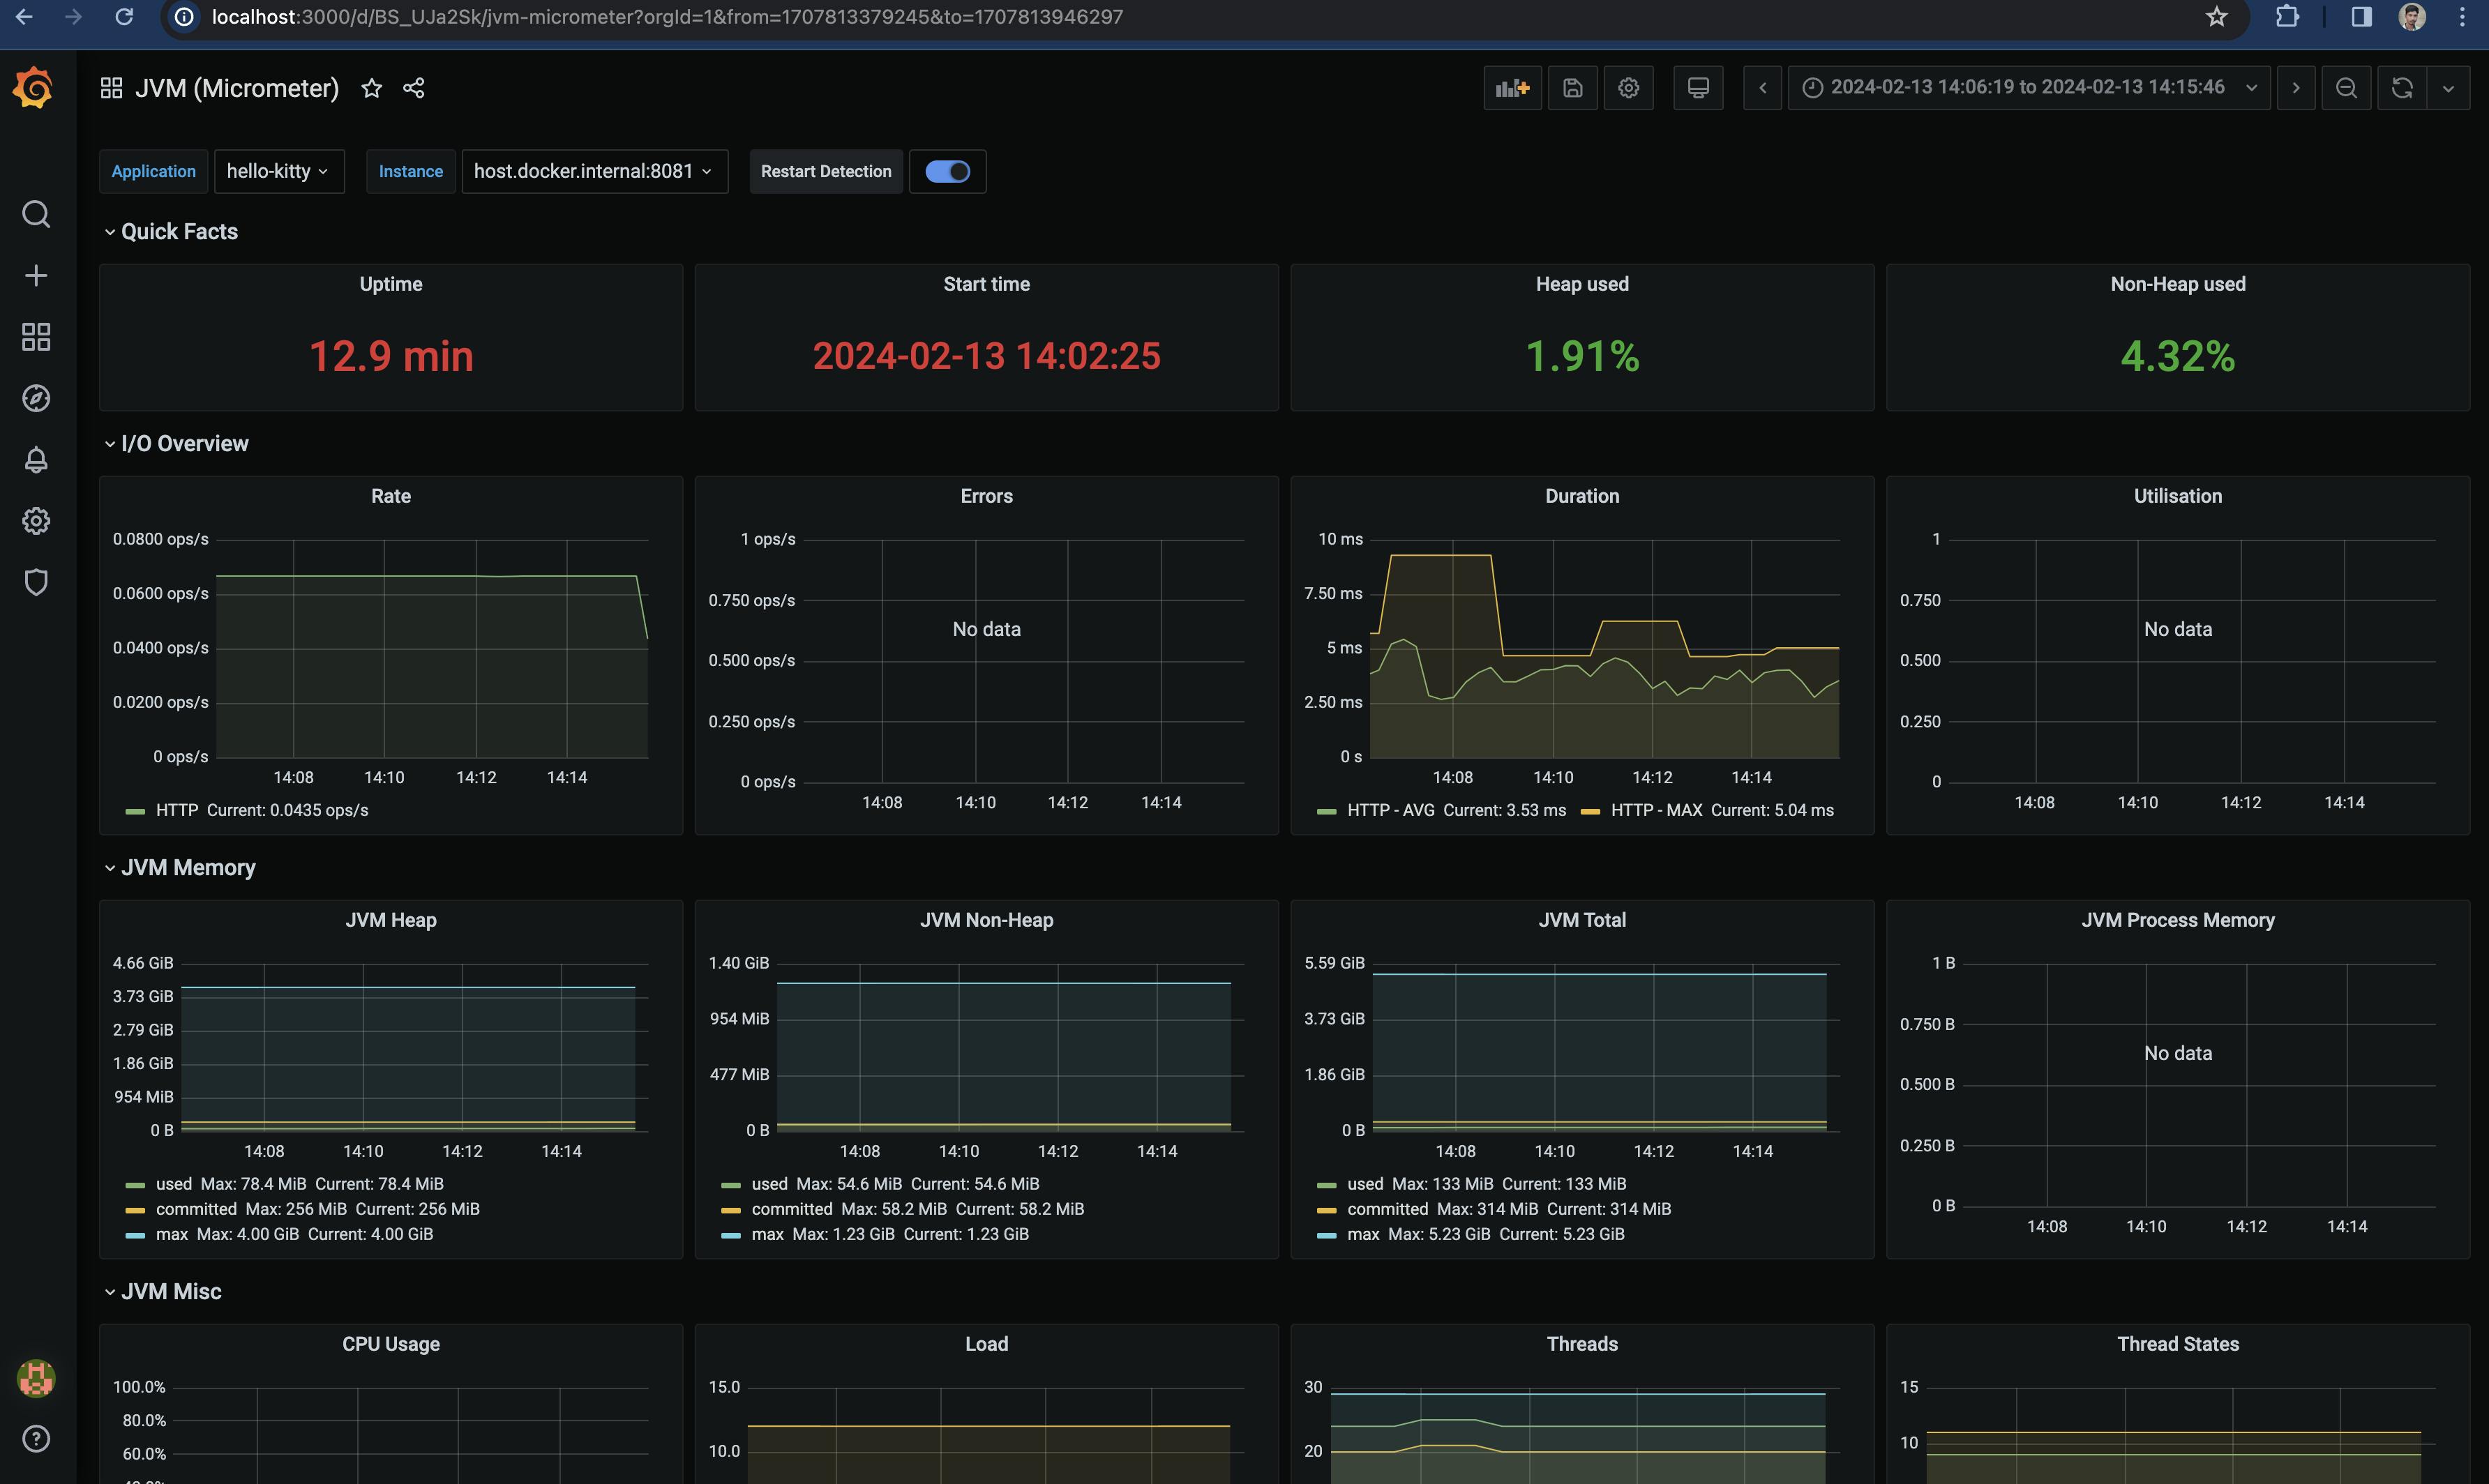
JVM dashboard is imported and it holds the below panels.
Quick Facts
I/O Overview
JVM Memory
JVM Misc
JVM Memory Pools (Heap & Non-Heap)
Garbage collection
Classloading
Buffer Pools
